
Small caps are virtually unavoidable in a diversified equity strategy as they now represent just over 11% of global market capitalisation (see chart below).
MSCI World AC: Small caps weighting in the index

We also know that small caps offer a higher return over the very long term (“small is beautiful”), with a probability of outperformance that increases over time, but which comes up against specific risks (volatility, greater sensitivity to domestic economic conditions, information asymmetries due to weaker coverage by financial analysts, lesser liquidity, etc.).
While the outperformance of small caps vs. big caps is clear in the long term, their increased cyclicality leads to phases of over/underperformance that can be very marked and quite brutal. Hence the decisive importance of the entry point.
The interest of small caps for the investor increases with the investment horizon and appears quite clear at the beginning of an economic cycle. For example, US small caps outperform big caps by an average of 8% over a one-year horizon (6% on average over three years and 12% on median) after the post-war recession low. This is quite logical, as small caps generally have a growth bias.
As far as European small caps are concerned, there are several reasons to adopt a moderately aggressive positioning in their favour.
From a momentum perspective, the chart below shows that the relative decline in small vs. large caps has been particularly marked over the last 16 months. This is despite a rebound in early 2023.

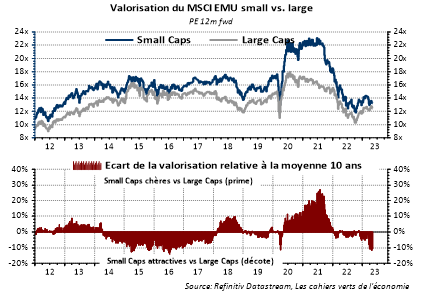
On the valuation front, the MSCI EMU Small Caps’ 12m forward P/E has returned to 13.4x from a low of 11.8x in mid-October at the worst of the equity stress. Nevertheless, it is still 16% below its 15-year average. In relative terms, small caps have historically traded at a premium to large caps (lower liquidity, higher risk and volatility…). Nevertheless, this premium is now 10% below its historical average (see chart below). In other words, in relative terms, small caps appear attractive vs. large caps.
.
What about the macro argument? Small caps are a “call” option on European growth: they perform well in absolute and relative terms (compared to large caps) when the cycle is well oriented in Europe. The EPS growth of European small caps is highly sensitive to the growth of activity in the Eurozone (ratio close to 4 to 1 to nominal GDP growth – see chart below).
.
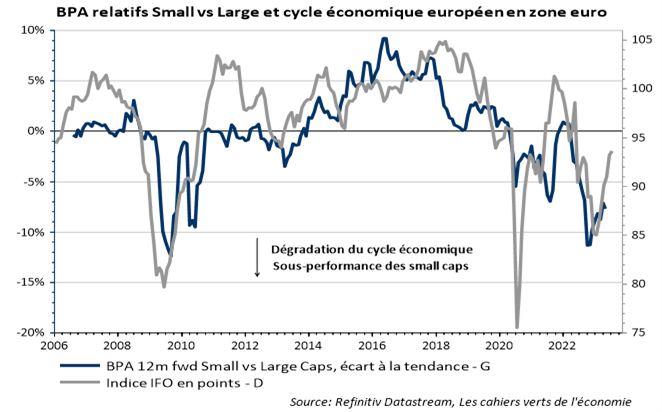
In general, there is a strong divergence (see chart below) between the difference in relative small cap performance (suggesting a sharp recession in the Eurozone) while the leading indicators of the economic cycle are recovering somewhat but remain at a mediocre level (suggesting activity in slightly positive territory).

From this point of view, the risk of negative EPS surprises for European small caps seems limited and the underperformance of small caps in recent months seems exaggerated.
A final argument on the euro: We know that European small caps are less international and export-oriented than large caps. They generate a little over 70% of their sales in the Eurozone compared with just over 60% for large caps. They are therefore penalised in relative terms when the euro falls. This was notably the case for most of 2022. Conversely, a rise in the euro is favourable to them in relative terms (see graph below).

However, it is undeniable that since the euro has been rising (almost 8 months), this has hardly benefited the small caps in relative terms.