For the past 6 months, European small caps have no longer been underperforming large caps, after a very difficult 2022 and start to 2023.
European small caps were hit hard by a combination of:
- zero volume growth in the eurozone, despite the fact that, unlike large caps, small caps have a strong domestic bias;
- a fall in the value of the euro, which gave a relative advantage to exporting companies (and therefore to the more international large caps);
- a sharp tightening in financing conditions: rising interest rates, while the balance sheets of small and mid caps are generally less solid than those of large caps (more leverage), and a drying up of bank credit (the main source of financing for small caps, which are more dependent than large caps on the liquidity situation).
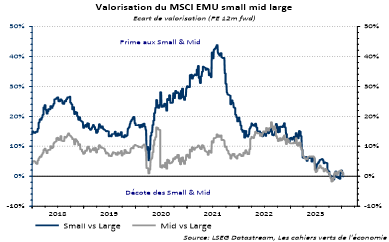
Over the last few months, investors have even begun to show a degree of enthusiasm for small caps, going slightly beyond macro surprises. Hence the recent consolidation (see chart below).
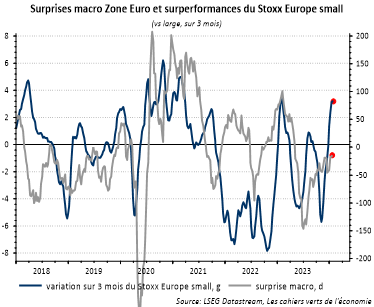
The fact remains that the stabilisation of the economic situation, the euro and the slight improvement in financial conditions have helped to stabilise the relative performance of small caps.
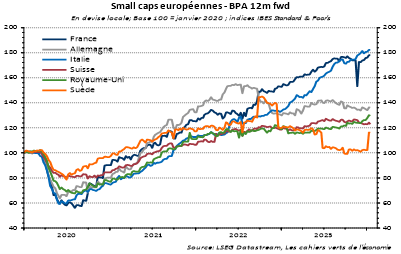
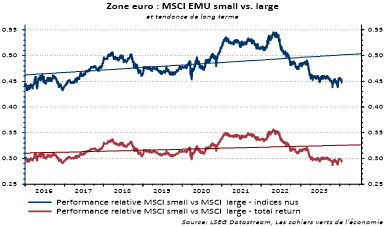
Looking ahead 6 months, we still believe that investors can begin to gradually and selectively move into long positions in small caps in certain regions before returning to the segment in the months ahead, when visibility on European growth and financial conditions has improved. It should be remembered that, on a long-term trend (see chart below), small caps are significantly outperforming large caps due to their growth bias (blue curve). Total return outperformance is less pronounced (red curve), as small caps pay fewer dividends – or none at all – than large caps.
Nevertheless, the potential for long-term outperformance (given the long-term trend) remains substantial (see chart below).
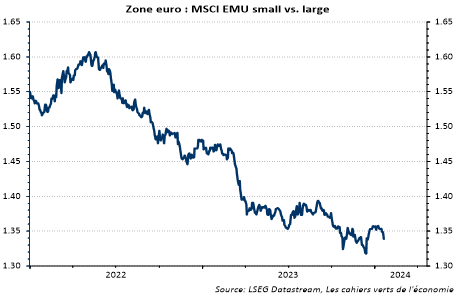
Small and mid caps are not expensive. In relative terms, it is usual to see a valuation gap between small/mid caps and large caps. The premium has averaged just over 20% over the last 15 years, justified by more robust EPS expectations for small caps than for large caps. Today, the premium is barely positive (see chart below).
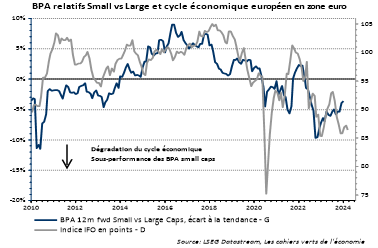
At the same time, EPS growth for European small caps is highly sensitive to economic growth in the eurozone (a ratio of almost 4:1 to nominal GDP growth – see chart below), as mentioned above. Relative EPS are broadly in line with a very weak IFO index (see chart below). From this point of view, the risk of negative EPS surprises for European small caps seems limited unless we forecast a deep recession in the Eurozone, which is not our scenario.
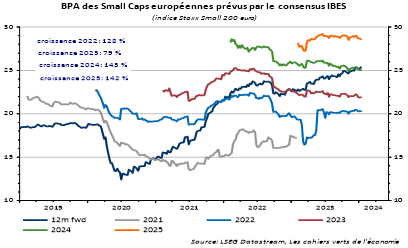
Another way of looking at things is to examine EPS expectations for 2024 and 2025. The latter (+14% in both cases) seem a little high (see chart below).
Finally, in the context of European equity management, the Mid Cap Europe index is much more geographically diversified than the MSCI Europe index. The weighting of the 4 largest countries (UK, France, Switzerland, Germany) is just over 1/3 compared with over 2/3 for the MSCI Europe (see chart below).